Fan Ray Plot
Fan Ray Plot displays the location at which rays hit the IMAGE surface as a function of the ray’s fan angle. Use this plot to display ray aberration as a function of fan angle. In order to see a smooth plot, you should set the # of Fan Rays fairly high.

Wavefront Error Plot
Wavefront Error Plot displays the variation in optical path length between the OBJECT surface and the IMAGE surface as a function of source point location. Use this plot to see how flat the wavefront is on the IMAGE surface. In order to see a smooth plot, you should set the # of Source Points fairly high.

Grid Distortion
This plot show how regular square grid is distorted by the optical system. It can be used to study effects such as
Barrel distortion: In barrel distortion, image magnification decreases with distance from the optical axis. This is typically observed with a fisheye camera lens.
Pincushion distortion: In pincushion distortion, image magnification increases with the distance from the optical axis.

See also:
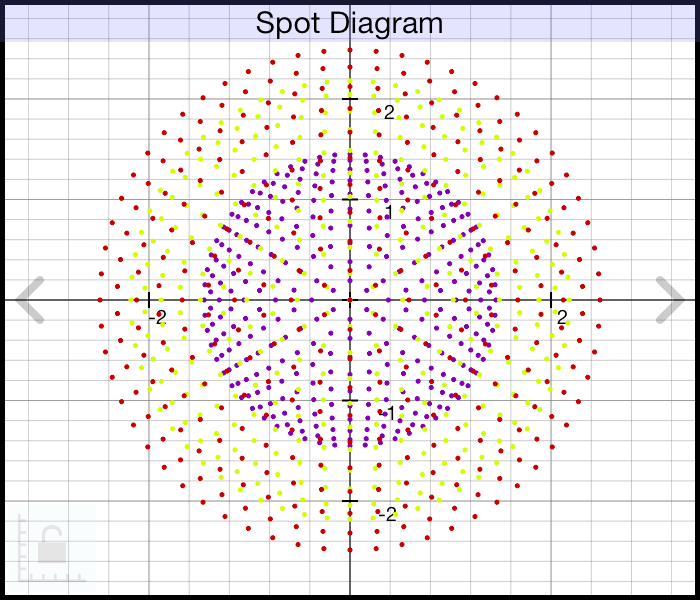
Spot Diagram
A lens spot diagram shown how a circular “spot” of light which should appear as a “spot” on the IMAGE plane actually appears as a result of passing thru the optical system. It provides a visual indication of image quality produced by the lens system. It can be used to see effects such as spherical aberration, coma, astigmatism, and chromatic aberration.
See also:
Spot Diagram (Filled)
This plot is similar to a Spot Diagram, but instead of drawing points for individual rays, displays shaded regions corresponding to cones of light from the source.

Chromatic Aberration
Gaussian Spot Size
This plot shows beam radius as a function of distance for a laser beam as it travels thru the optical system. When focusing a laser beam, the spot size (radius) w(z) will be at a minimum value w0 at one place along the beam axis, known as the beam waist. As the beam passes thru various optical components, additional waists may be seen.
In addition to spot size, the plot shows location and curvature of beam wavefronts. Near the waist, wavefronts are displayed with a spacing of 1Rayleigh range (zR). Away from the waist, they are displayed as pairs with a spacing of 10zR

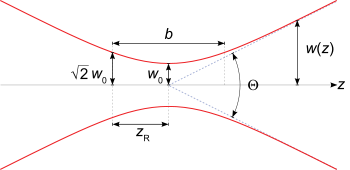
Gaussian beam width w(z) as a function of the axial distance z. w0: beam waist; b: depth of focus; zR: Rayleigh range; \Theta: total angular spread. [Source: Wikipedia]